|
In college, I took a course called "Finance for Non-Finance Majors" (I think the department head lost out on his preferred "Finance for Dummies" title). It's a good principle though--we aren't all going to be accountants or marketers or designers, but it can be useful as a small business owner, solopreneur, or anyone who collaborates with these functions to have a working knowledge of some of the principles and tools of other disciplines. For me, working in consumer research and insights, graphic design is a key complementary discipline. I firmly believe that market research needs great graphic design like a cupcake needs frosting. Great design pulls in your audience, helps you clearly communicate the story and makes the content more engaging. To that end, I often do work with professional graphic designers to help take my decks and reports to the next level. But I don’t always have the time or the budget to do that or frankly, sometimes I just need a deliverable that’s “good enough”. Over the years as an independent insights consultant, I’ve discovered a handful of resources that can make marketing my own business and creating proposals and reports for others more beautiful, more interesting and just overall, more professional-looking.  Icons Something I’ve picked up from working with actual designers is that a few, well-placed icons in a consistent style and color palette can really add that final level of polish to a report or other deliverable. I use The Noun Project and find it valuable enough to have actually ponied up for a paid subscription (very reasonable at $40/year currently). Sometimes icons are purely decorative, but they can work harder too. For example, if you use specific icons consistently throughout a report to represent particular consumer groups, those icons can stand in for text in complicated chart or graphics to make them easily readable.  Stock photography There is a lot of terrible stock photography out there. To avoid it, you basically have two choices. One, you can pay for a subscription to a high-quality stock image service like Adobe Stock or Shutterstock. That may be a good option if you need lots of images for commercial use, but it’s not cheap. Alternately, if you just need images occasionally and they don’t have to be super-specific, there are a few great, free stock photo sources. Two that I frequently use are: Unsplash, which has a beautiful, searchable website, and Death to Stock which sends free unique photos out in themed packs via email. Be sure to credit the creators appropriately (each site has their own guidelines).  Fonts Here’s what I know about special fonts: not using them can make materials look generic, but using them inappropriately makes you look like a complete idiot. I prefer to risk erring on the generic side, especially since I’m typically dealing with client-facing deliverables (vs. creative marketing output). That said, if you’re feeling brave, you can find lots of free and unique fonts on Dafont. Just remember that if you’re using a non-standard font, there’s a good chance it won’t look the same on someone else’s computer in a document (unless they have also downloaded the same font). When it doubt, send the document as a PDF to preserve fonts.  Infographics Here’s an area I would love to grow my own design expertise—creating infographics! There’s a reason information presented in this format gets shared so much online—if done right, it’s a fun and engaging way to communicate data. If I decide I simply must create my own infographic, the best option I’ve found is Venngage. They have a basic selection of free infographic templates that you can play around with online to create a custom version. If you love it, there are also paid subscriptions that give access to all the premium templates as well ($19/month for an individual). If you’re interested in data visualization more broadly, I also suggest you check out Viz-Fest, which is a (free) webinar series on the topic.  Photo editing If you are working with stock photography (or your own), you’ll likely need photo editing software at some point. If you don’t have the need level or expertise for an Adobe Creative Cloud subscription (e.g. Adobe Illustrator, Adobe Photoshop, etc.), you can stay in the Adobe family with Photoshop Elements (one-time purchase), which is a more basic and user-friendly version of Photoshop. There are a few good, free online photo editing sites as well. I recommend Fotor or Pixlr (the latter also has links on its homepage to free vector editor, fonts, and graphics sites). One of my most common image editing needs is just to reduce the file size of an image, particularly for use in email. The interface could use a little design help itself, but this free Image Optimizer site has always done the trick for me. If you work in market research (or marketing or any related disciplines), I highly recommend that you find an awesome freelance graphic designer or design firm to partner with, if you don’t work for a company with those resources in-house. Working with designers and seeing their creations is probably the best way to build your own eye for design. And for everything else, I hope these design tools and resources can help fill the gaps!
0 Comments
 Each year, Greenbook publishes the GRIT Report, a summary of market research industry trends based on a global survey of client and supply-side researchers. The findings are always insightful and help me better understand which research trends are really in play today and what’s coming next. Here are a few highlights from the most recent report that are particularly meaningful, along with some commentary from my experiences.
What really matters in consumer research?
Which trends are hype and which are game-changers?
What are client’s unmet needs from research suppliers?
You can learn more by reading the full GRIT Report (free to download). If you’re in the market research industry, I also encourage you to sign up for the GRIT Panel to participate in future industry surveys and receive advance copies of the reports in your inbox. “Innovation” and “Millennials” are indisputably two of today’s hottest business buzzwords; it seems like just about every company out there is seeking to produce the former and attract the later, but what do Millennials really consider to be innovations that matter in their lives? Using a visual research platform called GlimpzIt, we asked Millennials (age 19-35) to show us a picture that represents an innovative product or service they’ve purchased recently that made their life better in some way. Our respondents, who were primarily women (90%) with an average age of 29, uploaded images (called “glimpzes”) to visually demonstrate what was important to them about the innovative product or service they chose. They included a short text caption to explain their choice. These images were evaluated by a panel of peers to see which ones resonated with them, resulting in a total of 200 respondents and peer evaluators. Overall, these Millennials’ responses indicate that innovation for them has much more to do with how it fits in their lives and enables them to meet their goals and aspiration than any actual features or technological advances. Many of the products chosen wouldn’t even be characterized by most marketers as “innovative”, including such everyday items as an alarm clock, a stand mixer, an electric kettle, a baby blanket, and removable storage hooks. Five key themes emerged from this research: Family, Time, Relax, Easy and Multi-Purpose. The first three things are “life” benefits, the last is product-focused and Easy straddles both. Selected pictures and comments shown below are from those actually submitted by the research respondents.  1. Family Lots of the products and services selected improved these people’s lives by offering benefits to their family—more space, ability to cook food everyone loves, comfort/entertain a child, and even the ability to grow one’s family (a fertility treatment!). Several people talked about the primary benefit of the selected product/service as enabling quality time spent together as a family. One respondent, talking about the meal-delivery service Blue Apron, summarized it beautifully as, “it's not just meals at your door, but it's an experience you can share with your loved ones.” 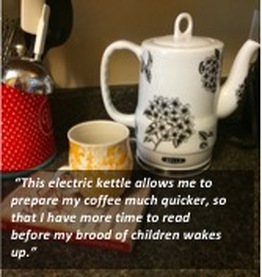 2. Time Time in this context is primarily about saving time. For some people, this means having more time for things they enjoy. The picture and caption above speak to valuable moments re-captured for a busy mom by her electric kettle so she can indulge in a good book before her kids wake up. Another woman thought her new alarm clock was innovative, because with it, she can actually wake up in time to eat breakfast! On the flip side, several people talked about products that help get the most out of the time they have. One woman praised the multi-tasking ability of her smartphone (“I feel like my iPhone has helped me do so many things at once!”) while another was excited about the additional RAM she recently added to her computer to make it run faster. 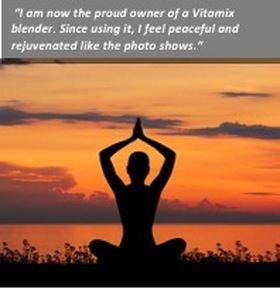 3. Relax With Millennials’ busy lives, finding ways to relax, re-charge, and de-stress are highly important. But the products and services these respondents said helped them feel relaxed and peaceful aren’t all necessarily what you might expect. This photo represents peace and rejuvenation derived from a blender! Another woman talked about how her new phone’s camera took beautiful pictures which helped her feel less stress and more peace. The take-away here is that products that are a delight to use and make it simple to get the results you want are giving Millennials a sense of relaxation, calm and peace. Winding down after a busy day and getting some much-needed rest is also key. One person shared a picture of her new LED bedroom night light, saying, “…it makes the night so relaxing and calm. I sleep much better now.” 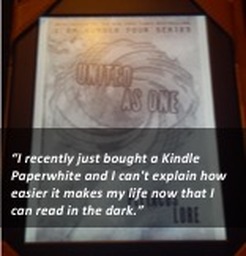 4. Easy Millennials in this research view products that are easy to use and make life easier as meaningful innovations. In some cases, this may be linked with the earlier time-saving or relaxation themes, as one woman describes about the beautiful pictures her new smartphone takes, “It makes my life easier and less stressful so I feel more at peace.” Just having an easy-to-use product with a simple, effective design can be a delight in and of itself. One woman shared her Apple TV as an innovation example because of its simple interface, while others love apps that make things easy without professional expertise (e.g. money management, photo editing). 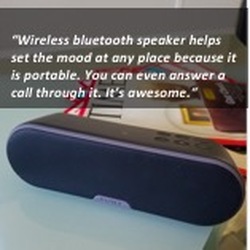 5. Multi-Purpose Millennials value products that have multiple functions, uses, or even can be used in multiple locations as making their life better. Several in this research specifically chose smart/connected products that do multiple jobs as their favorite recent innovations. One woman talked about how she loves that her smartphone “has helped me do so many things at once.” While another showed a picture of her smart TV that also lets her access games and classic movies to share with her kids. In summary, when seeking to innovate for Millennials, prioritize products and services that help them connect with family, save time, help them feel relaxed and calm, are easy to use and make their lives easier, and serve multiple functions. Consider also how existing products, services, and advertising can be tweaked or adapted to communicate these important benefits.
|
AuthorSarah Faulkner, Owner Faulkner Insights Archives
July 2021
Categories
All
|
 RSS Feed
Copyright 2014-2024
All Rights Reserved
All Rights Reserved